The Seismic Information Gap
The graph on the left is a representation of what I call The Seismic Information Gap. It shows two quantities. The first is the total amount of recoverable geological information (TRI) in a typical seismic dataset and how it has evolved over time. The second is the visually recoverable information (VRI). In short, the VRI is what you see when you look at your seismic. Think of it as the amount of the total information in your seismic that you use in an interpretation.
You should not take either quantity verbatim. They are my idealised impression of how both quantities have evolved over time. The TRI, for example, shows that seismic remained static for the early part of its history but then rapidly evolved from the 1960’s onwards when we developed digital seismic, before tailing off in recent years. The VRI, shows the effect of introducing modern wiggle trace displays (early 1960’s), grayscale displays (late 1960’s) and finally, variable density displays (late 1970’s).
We can argue all day about the shape of the curves. What we cannot argue is that without the industry realizing it, a massive gap has evolved between the total amount of recoverable geological information in your seismic and the amount you can see and therefore use in your interpretations. I call that gap “The Seismic Information Gap.” Recognizing that it exists, implementing the technology to close it, and discovering the importance of what lies within it are critical for the future of exploration and our ability to provide the hydrocarbons the world demands.
Examine the Details
You already know the gap exists
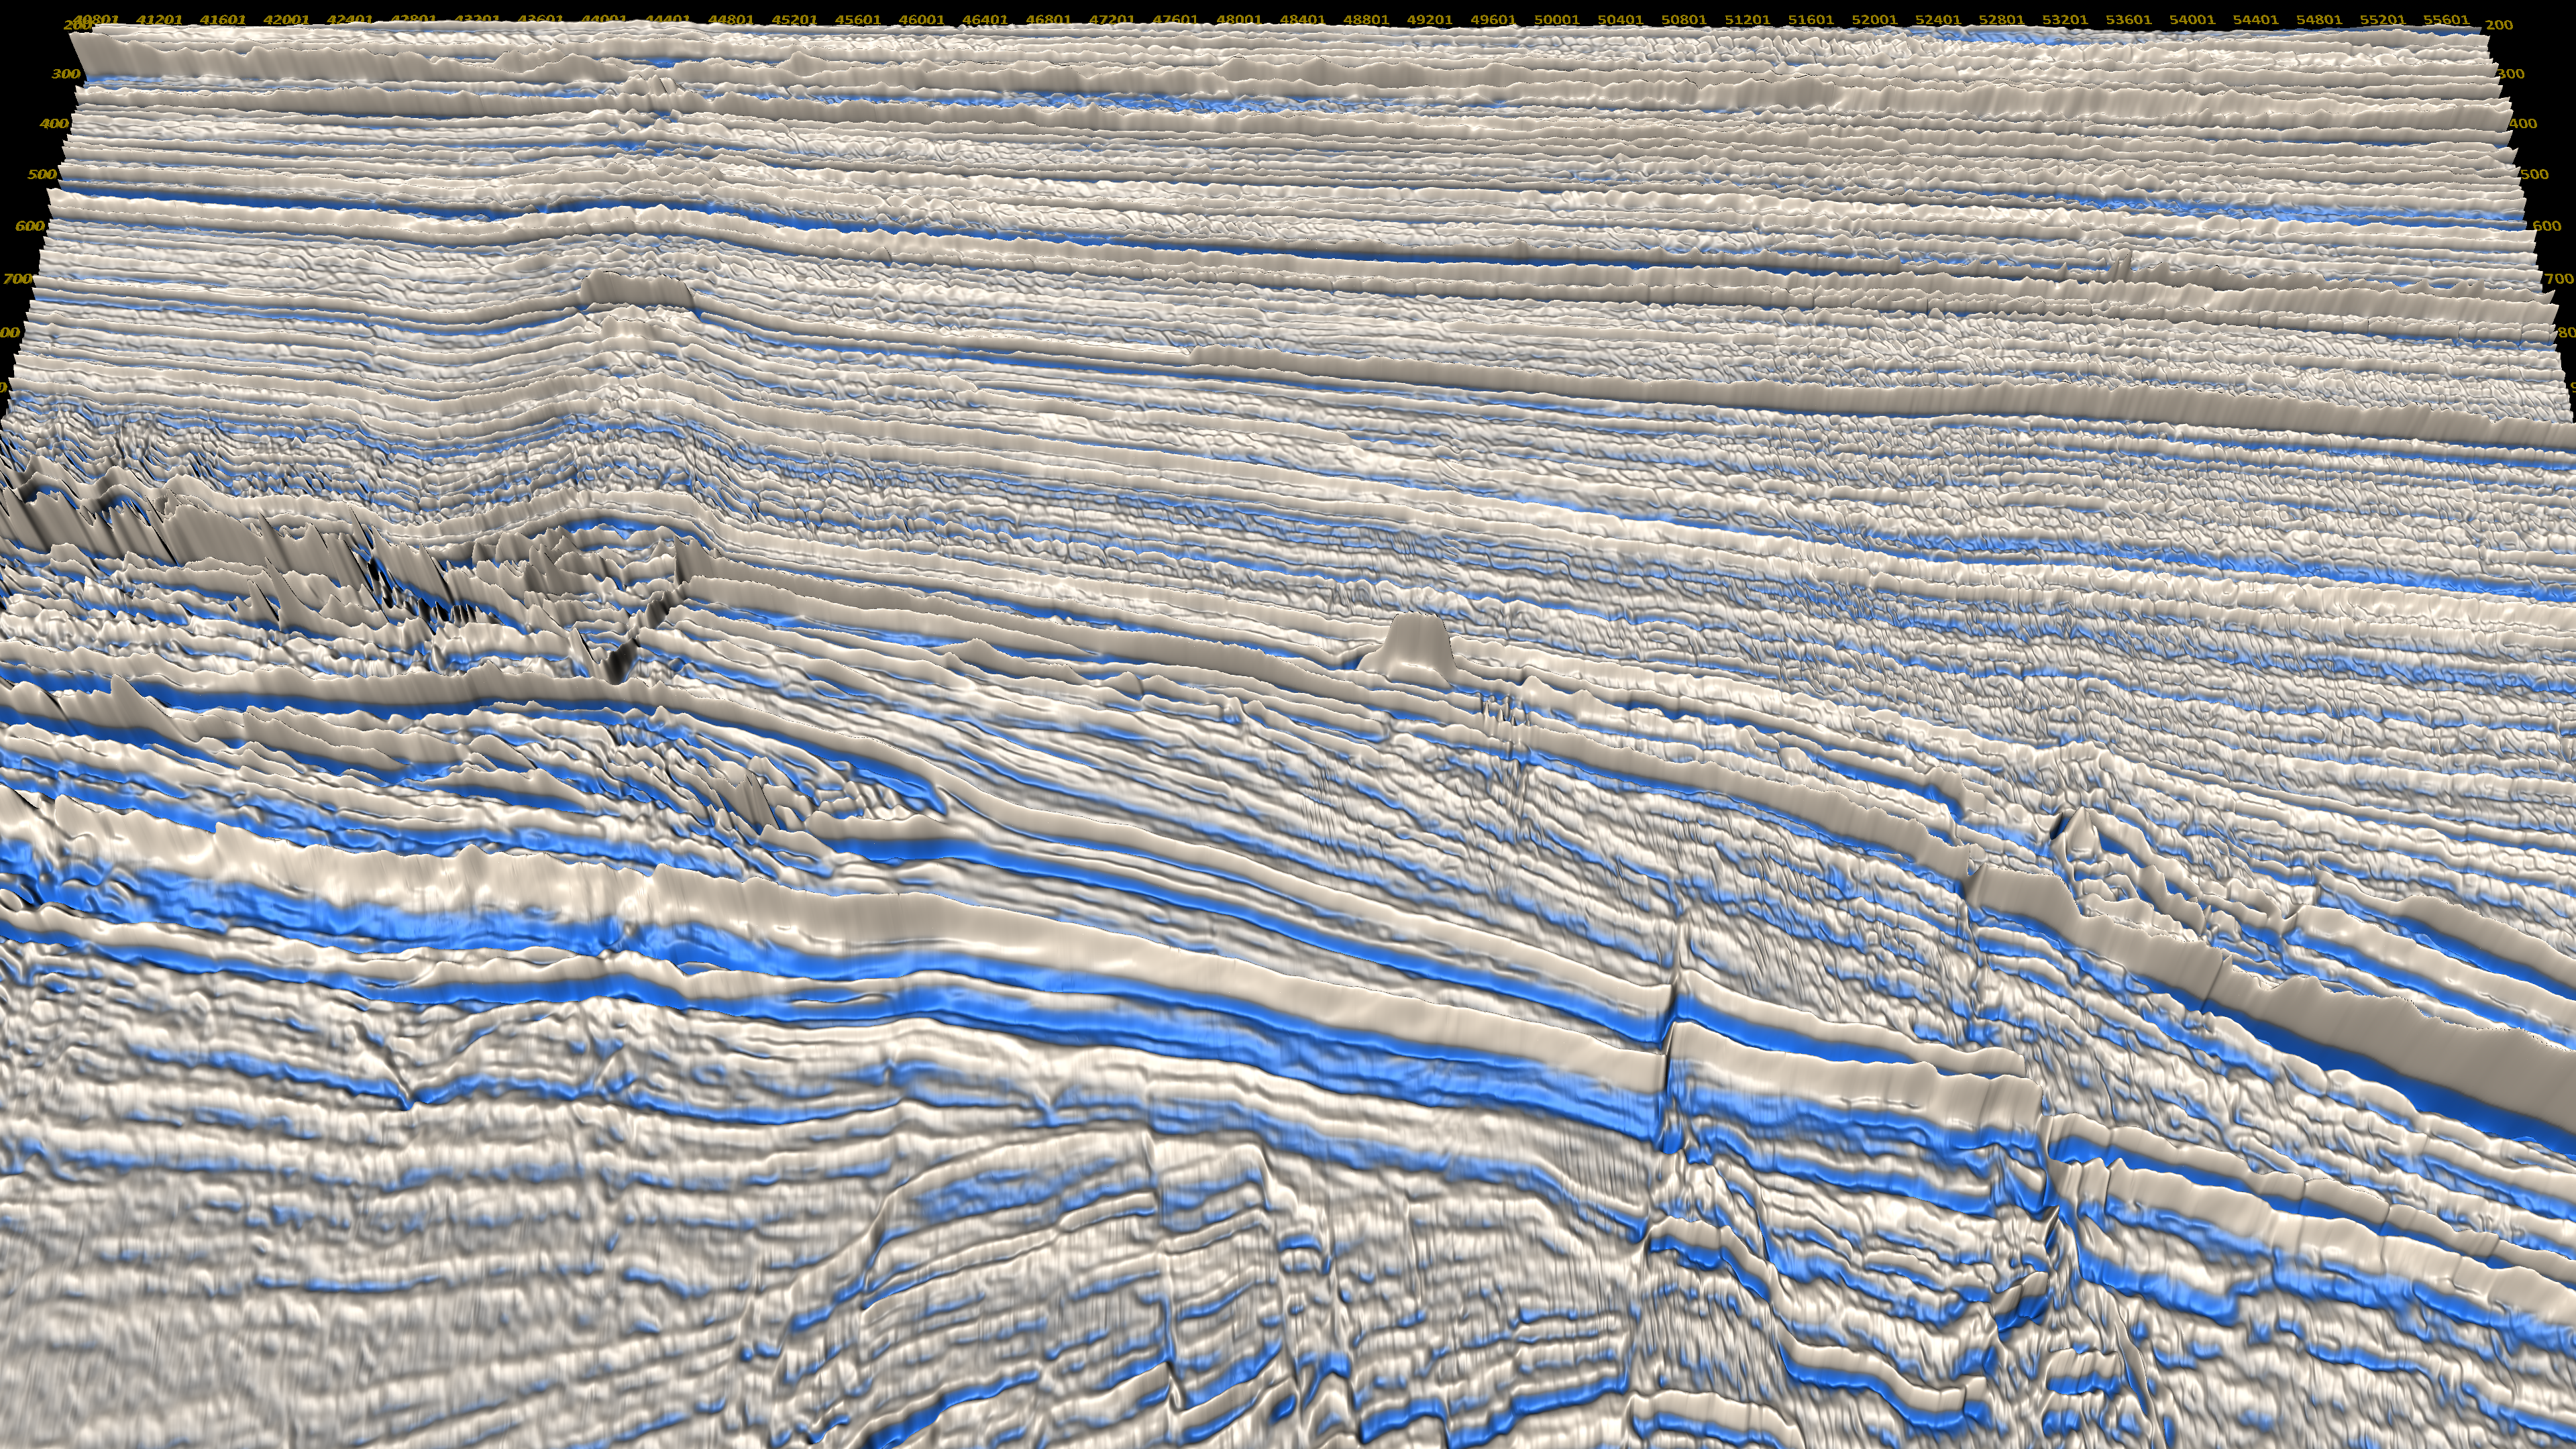
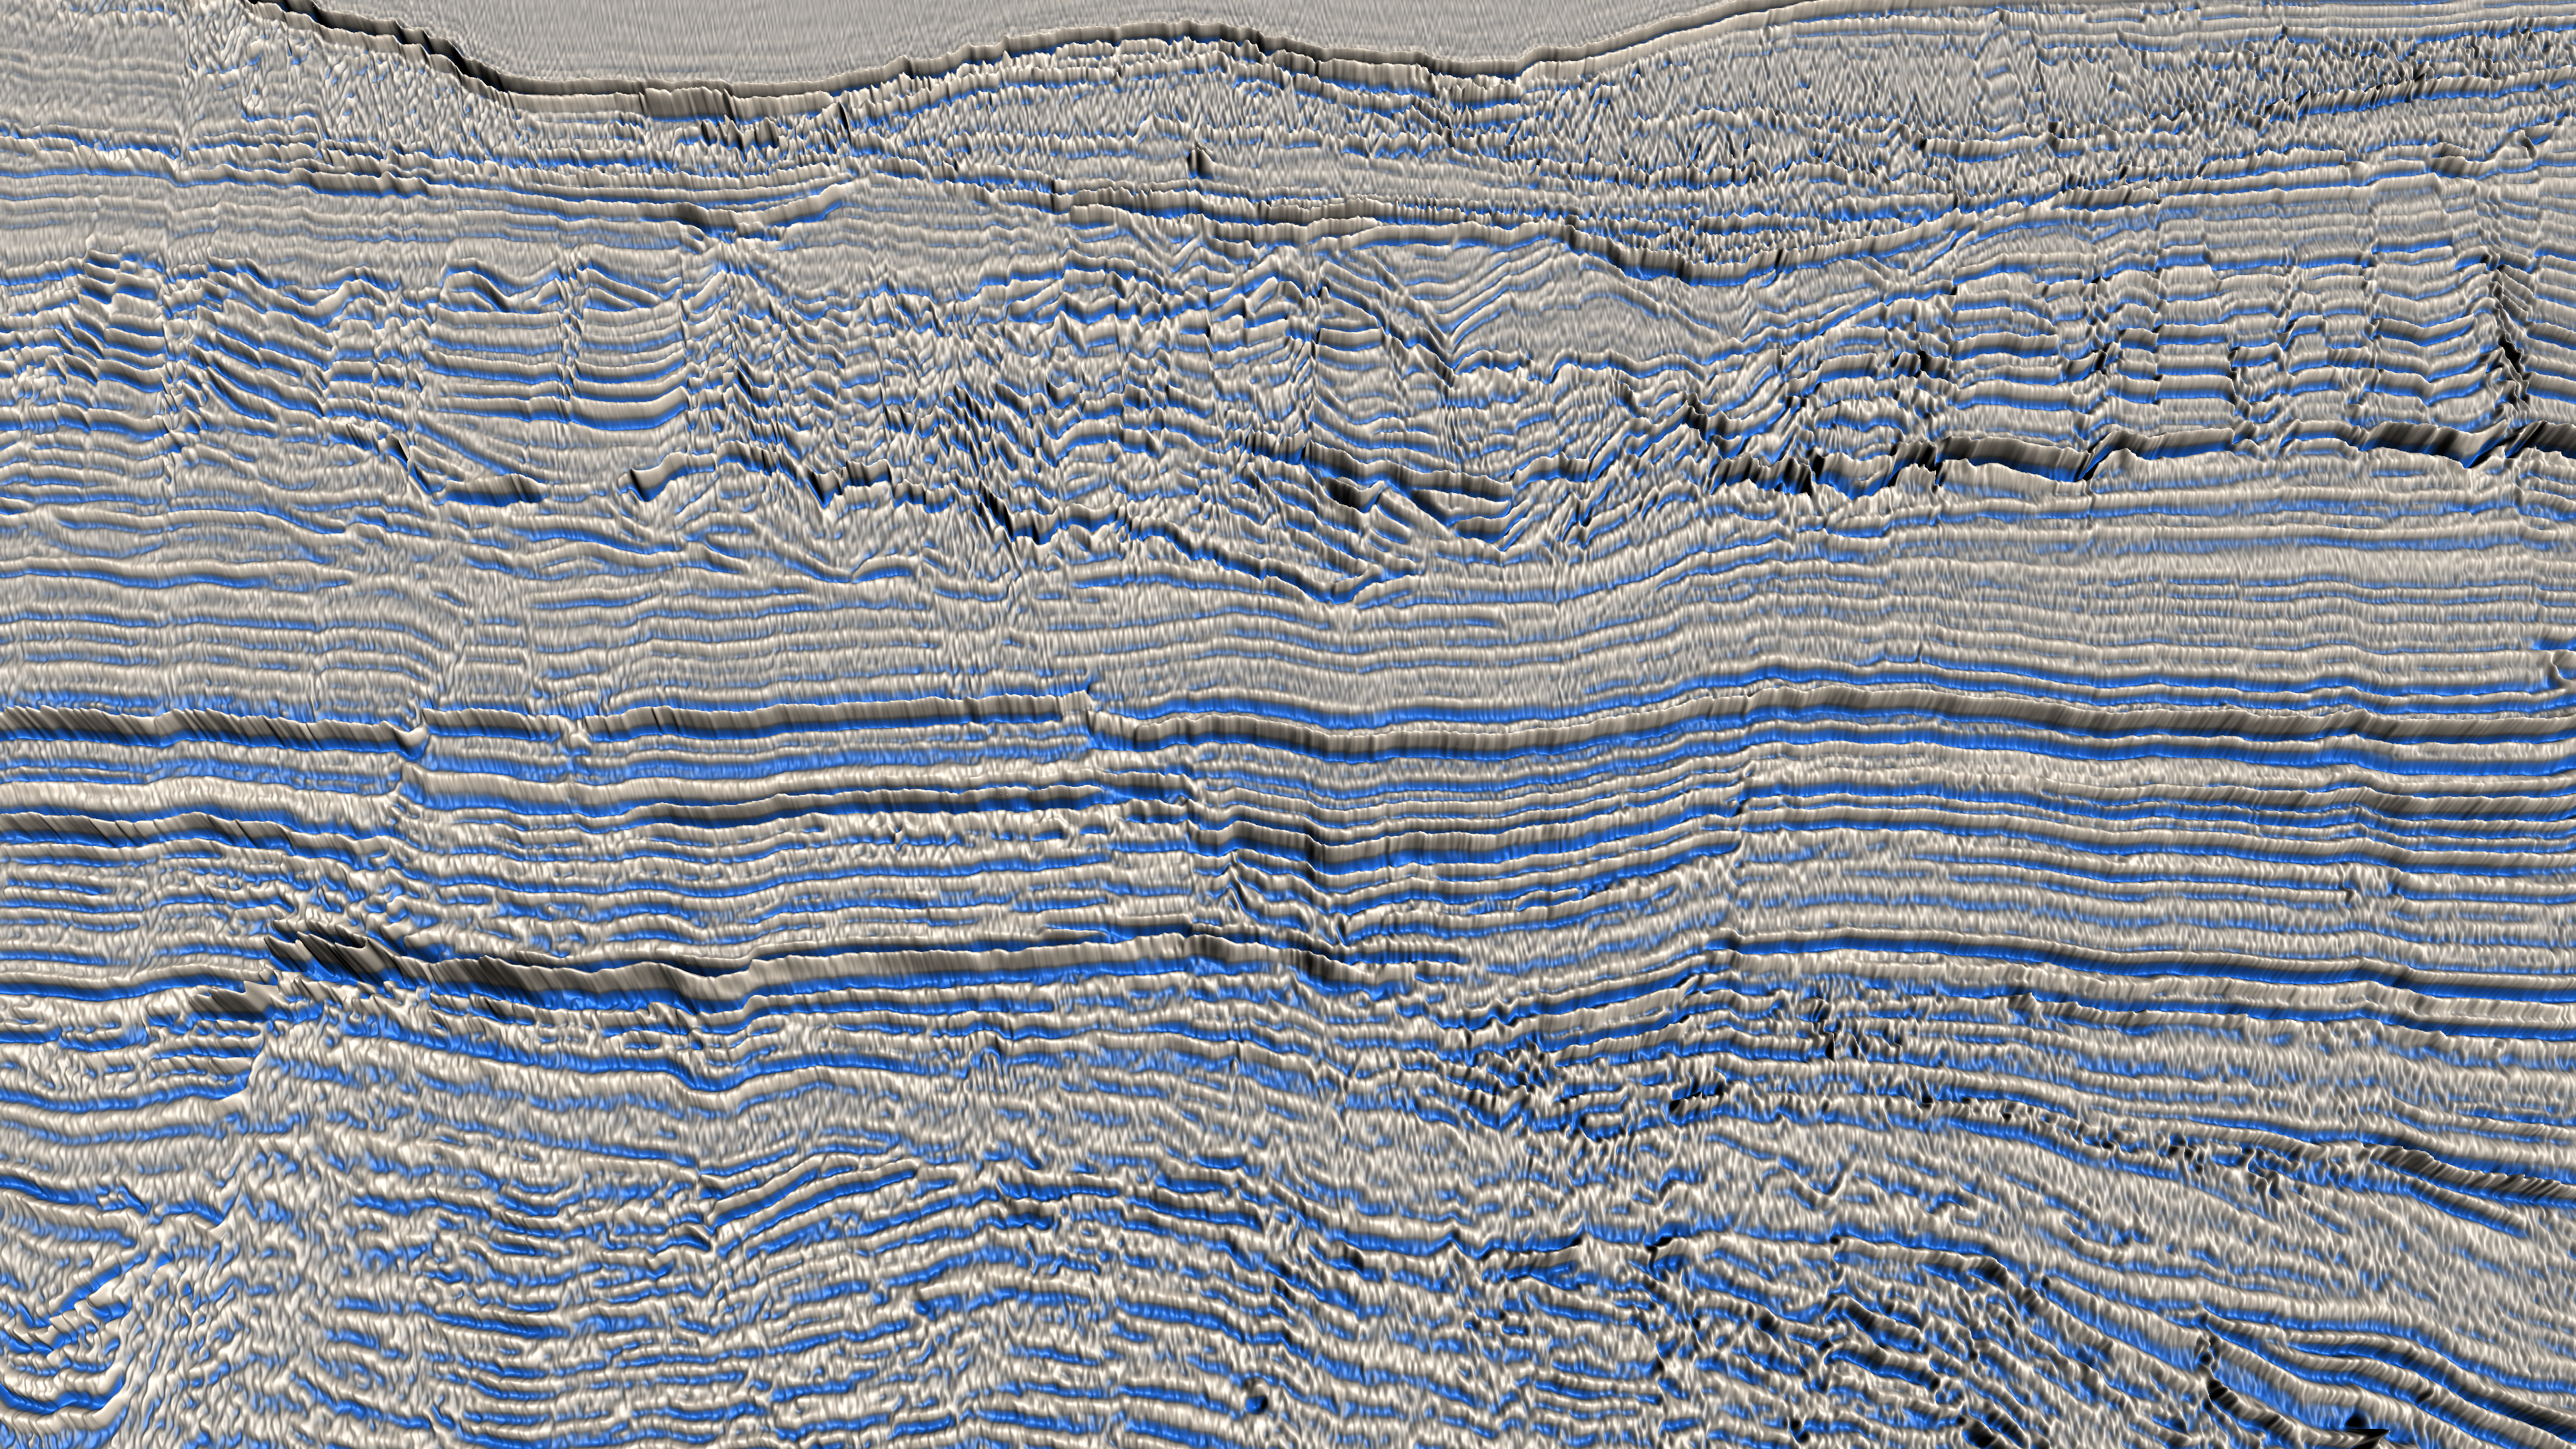
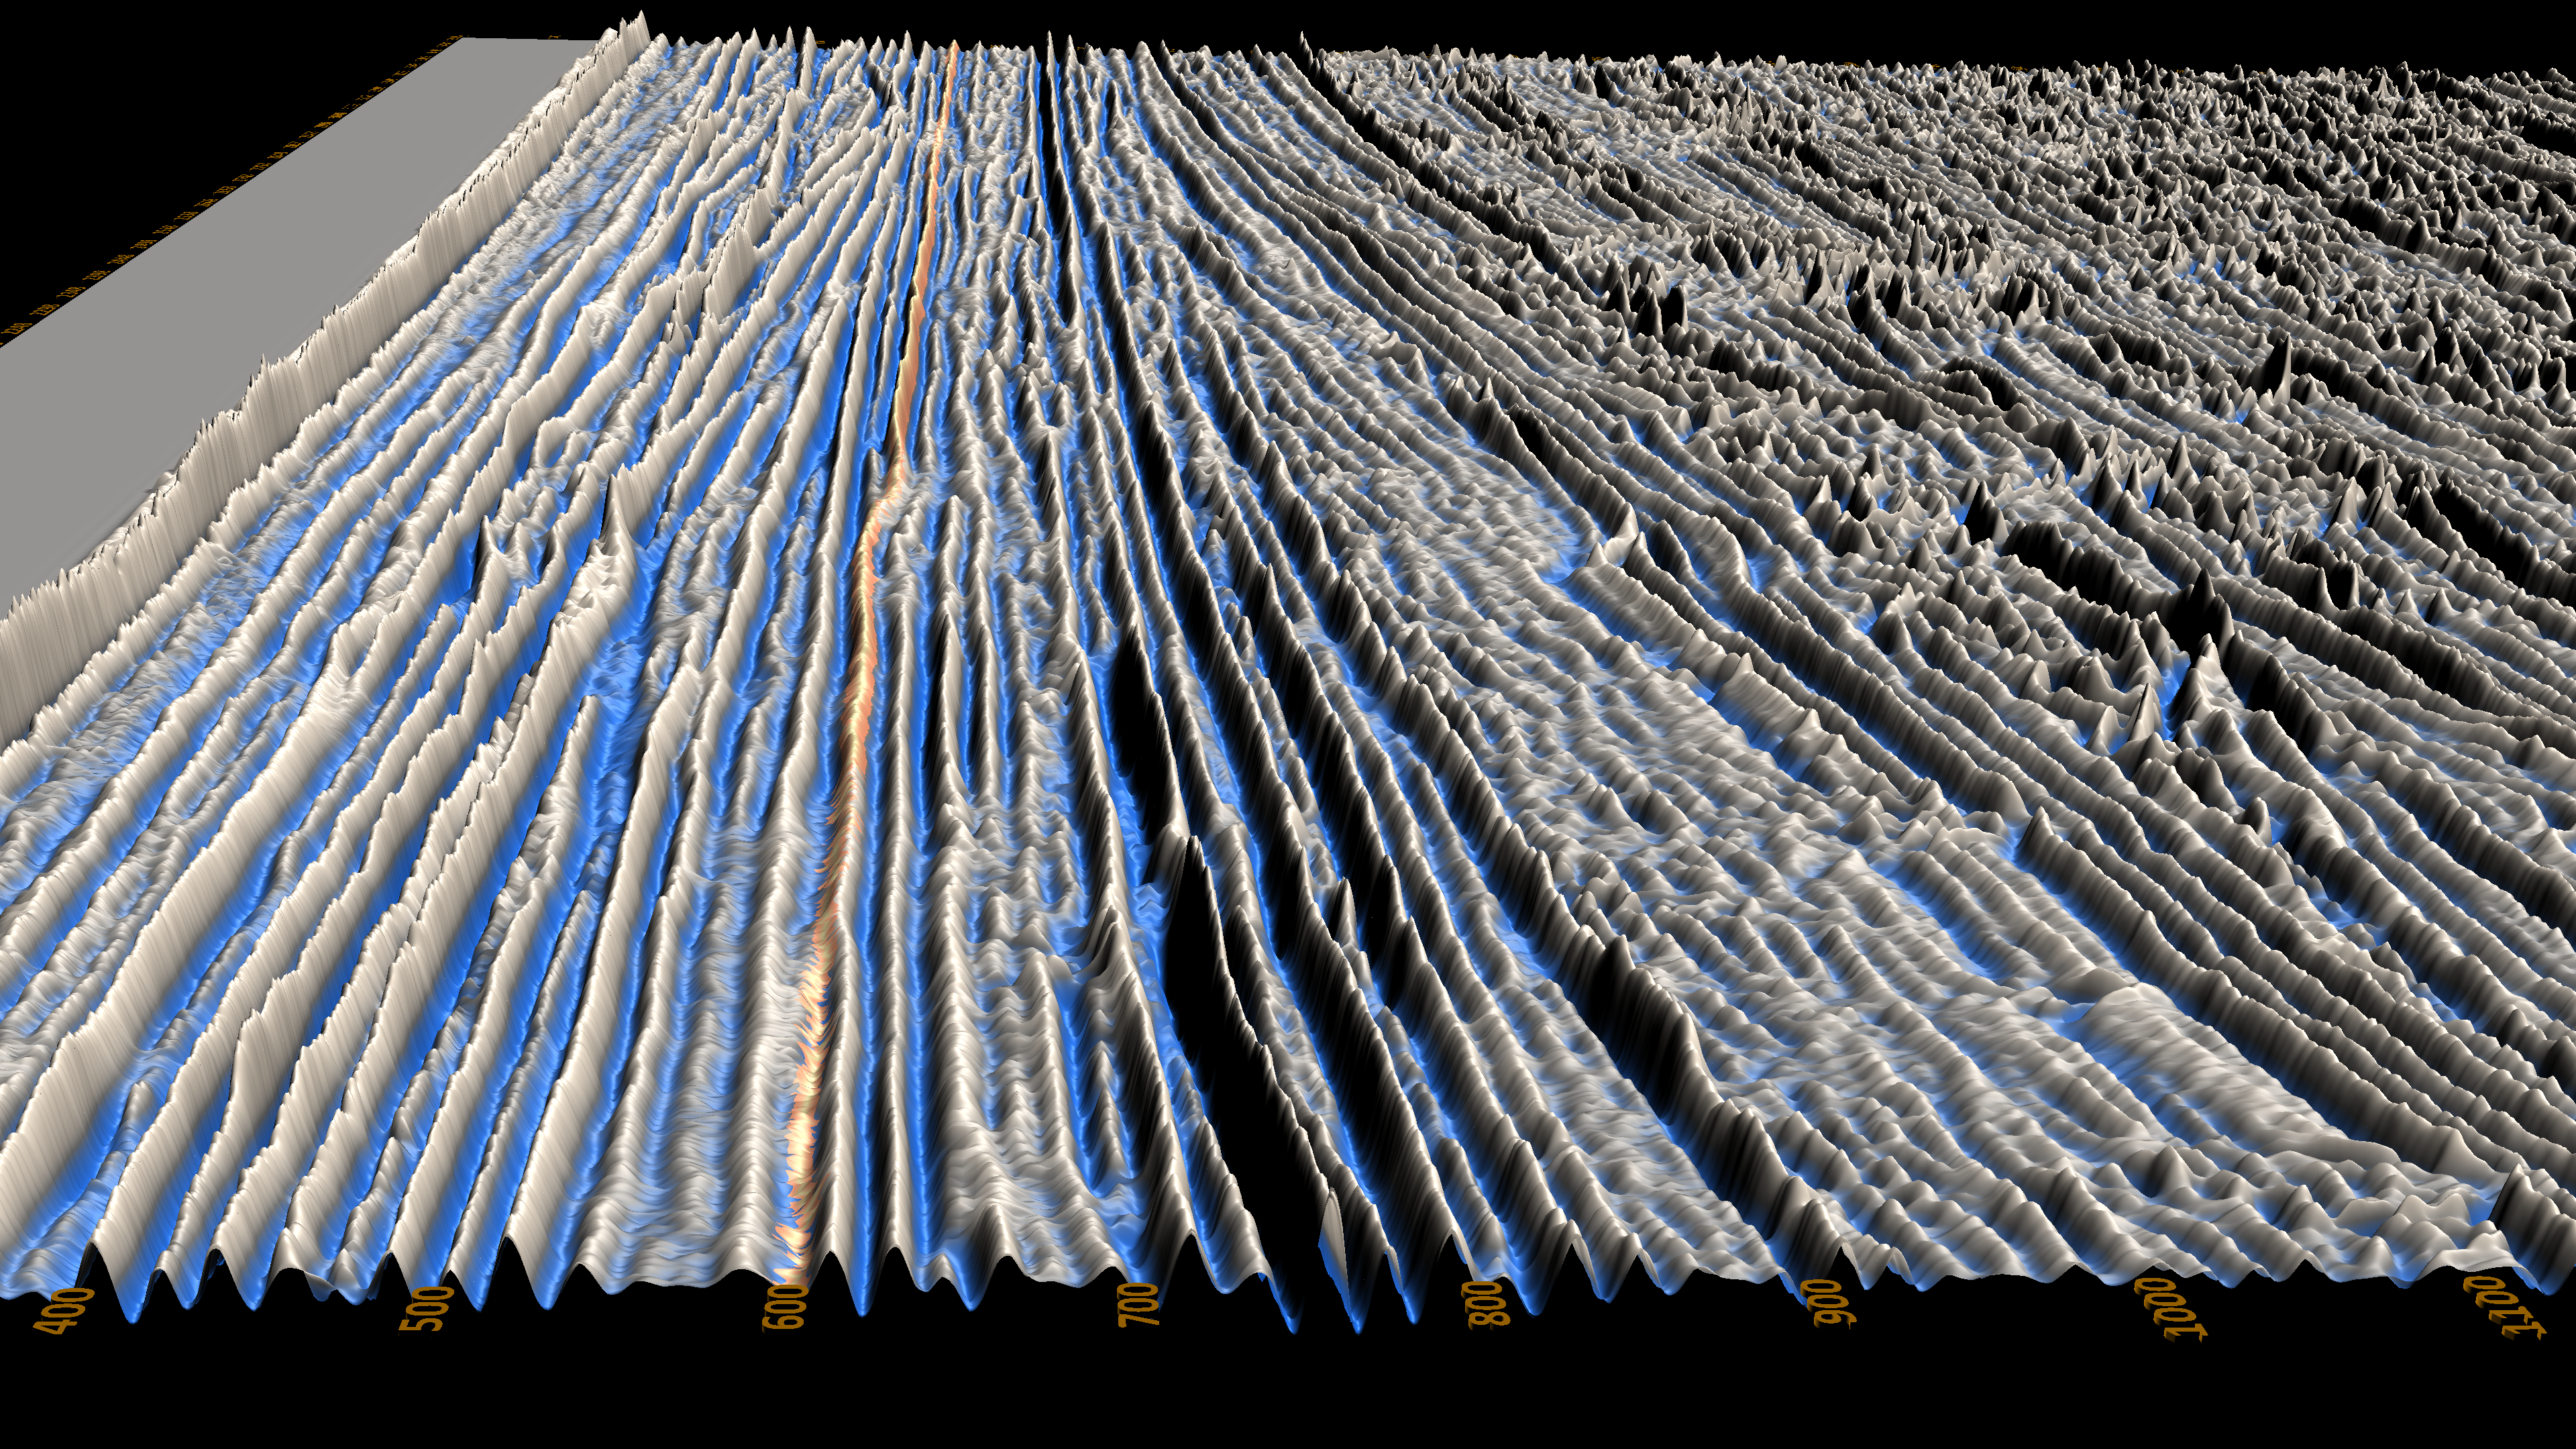
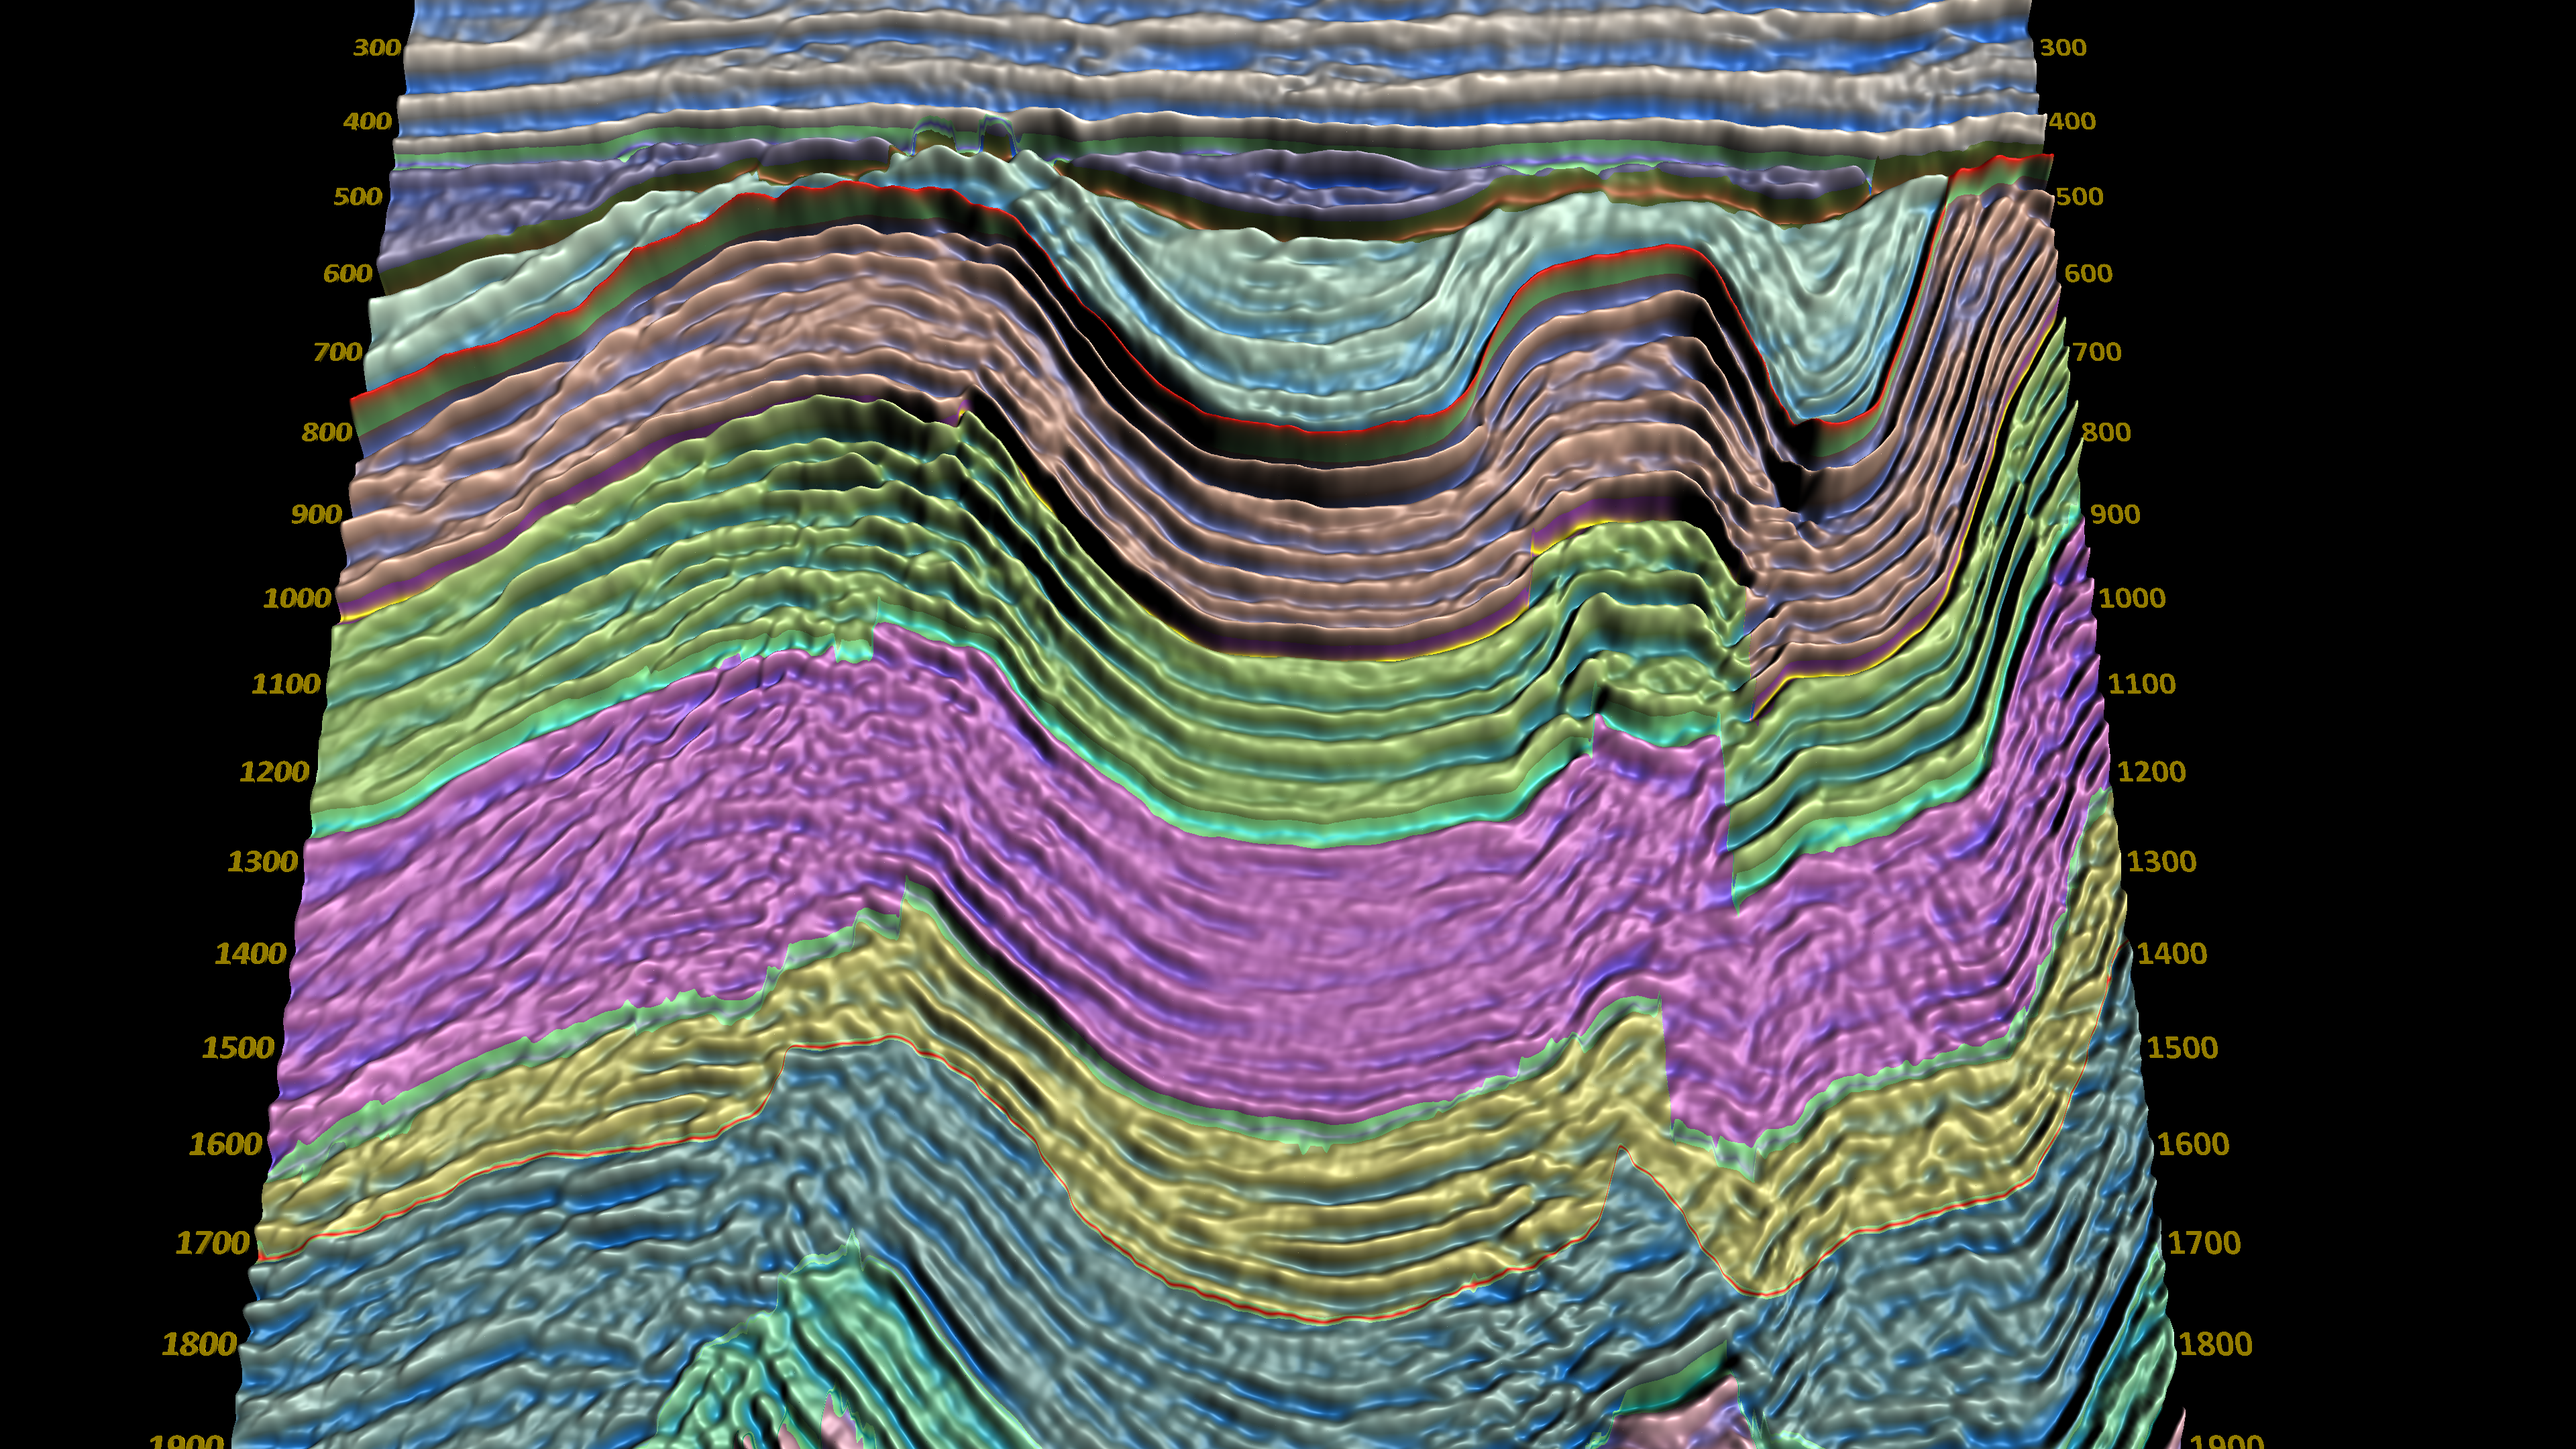
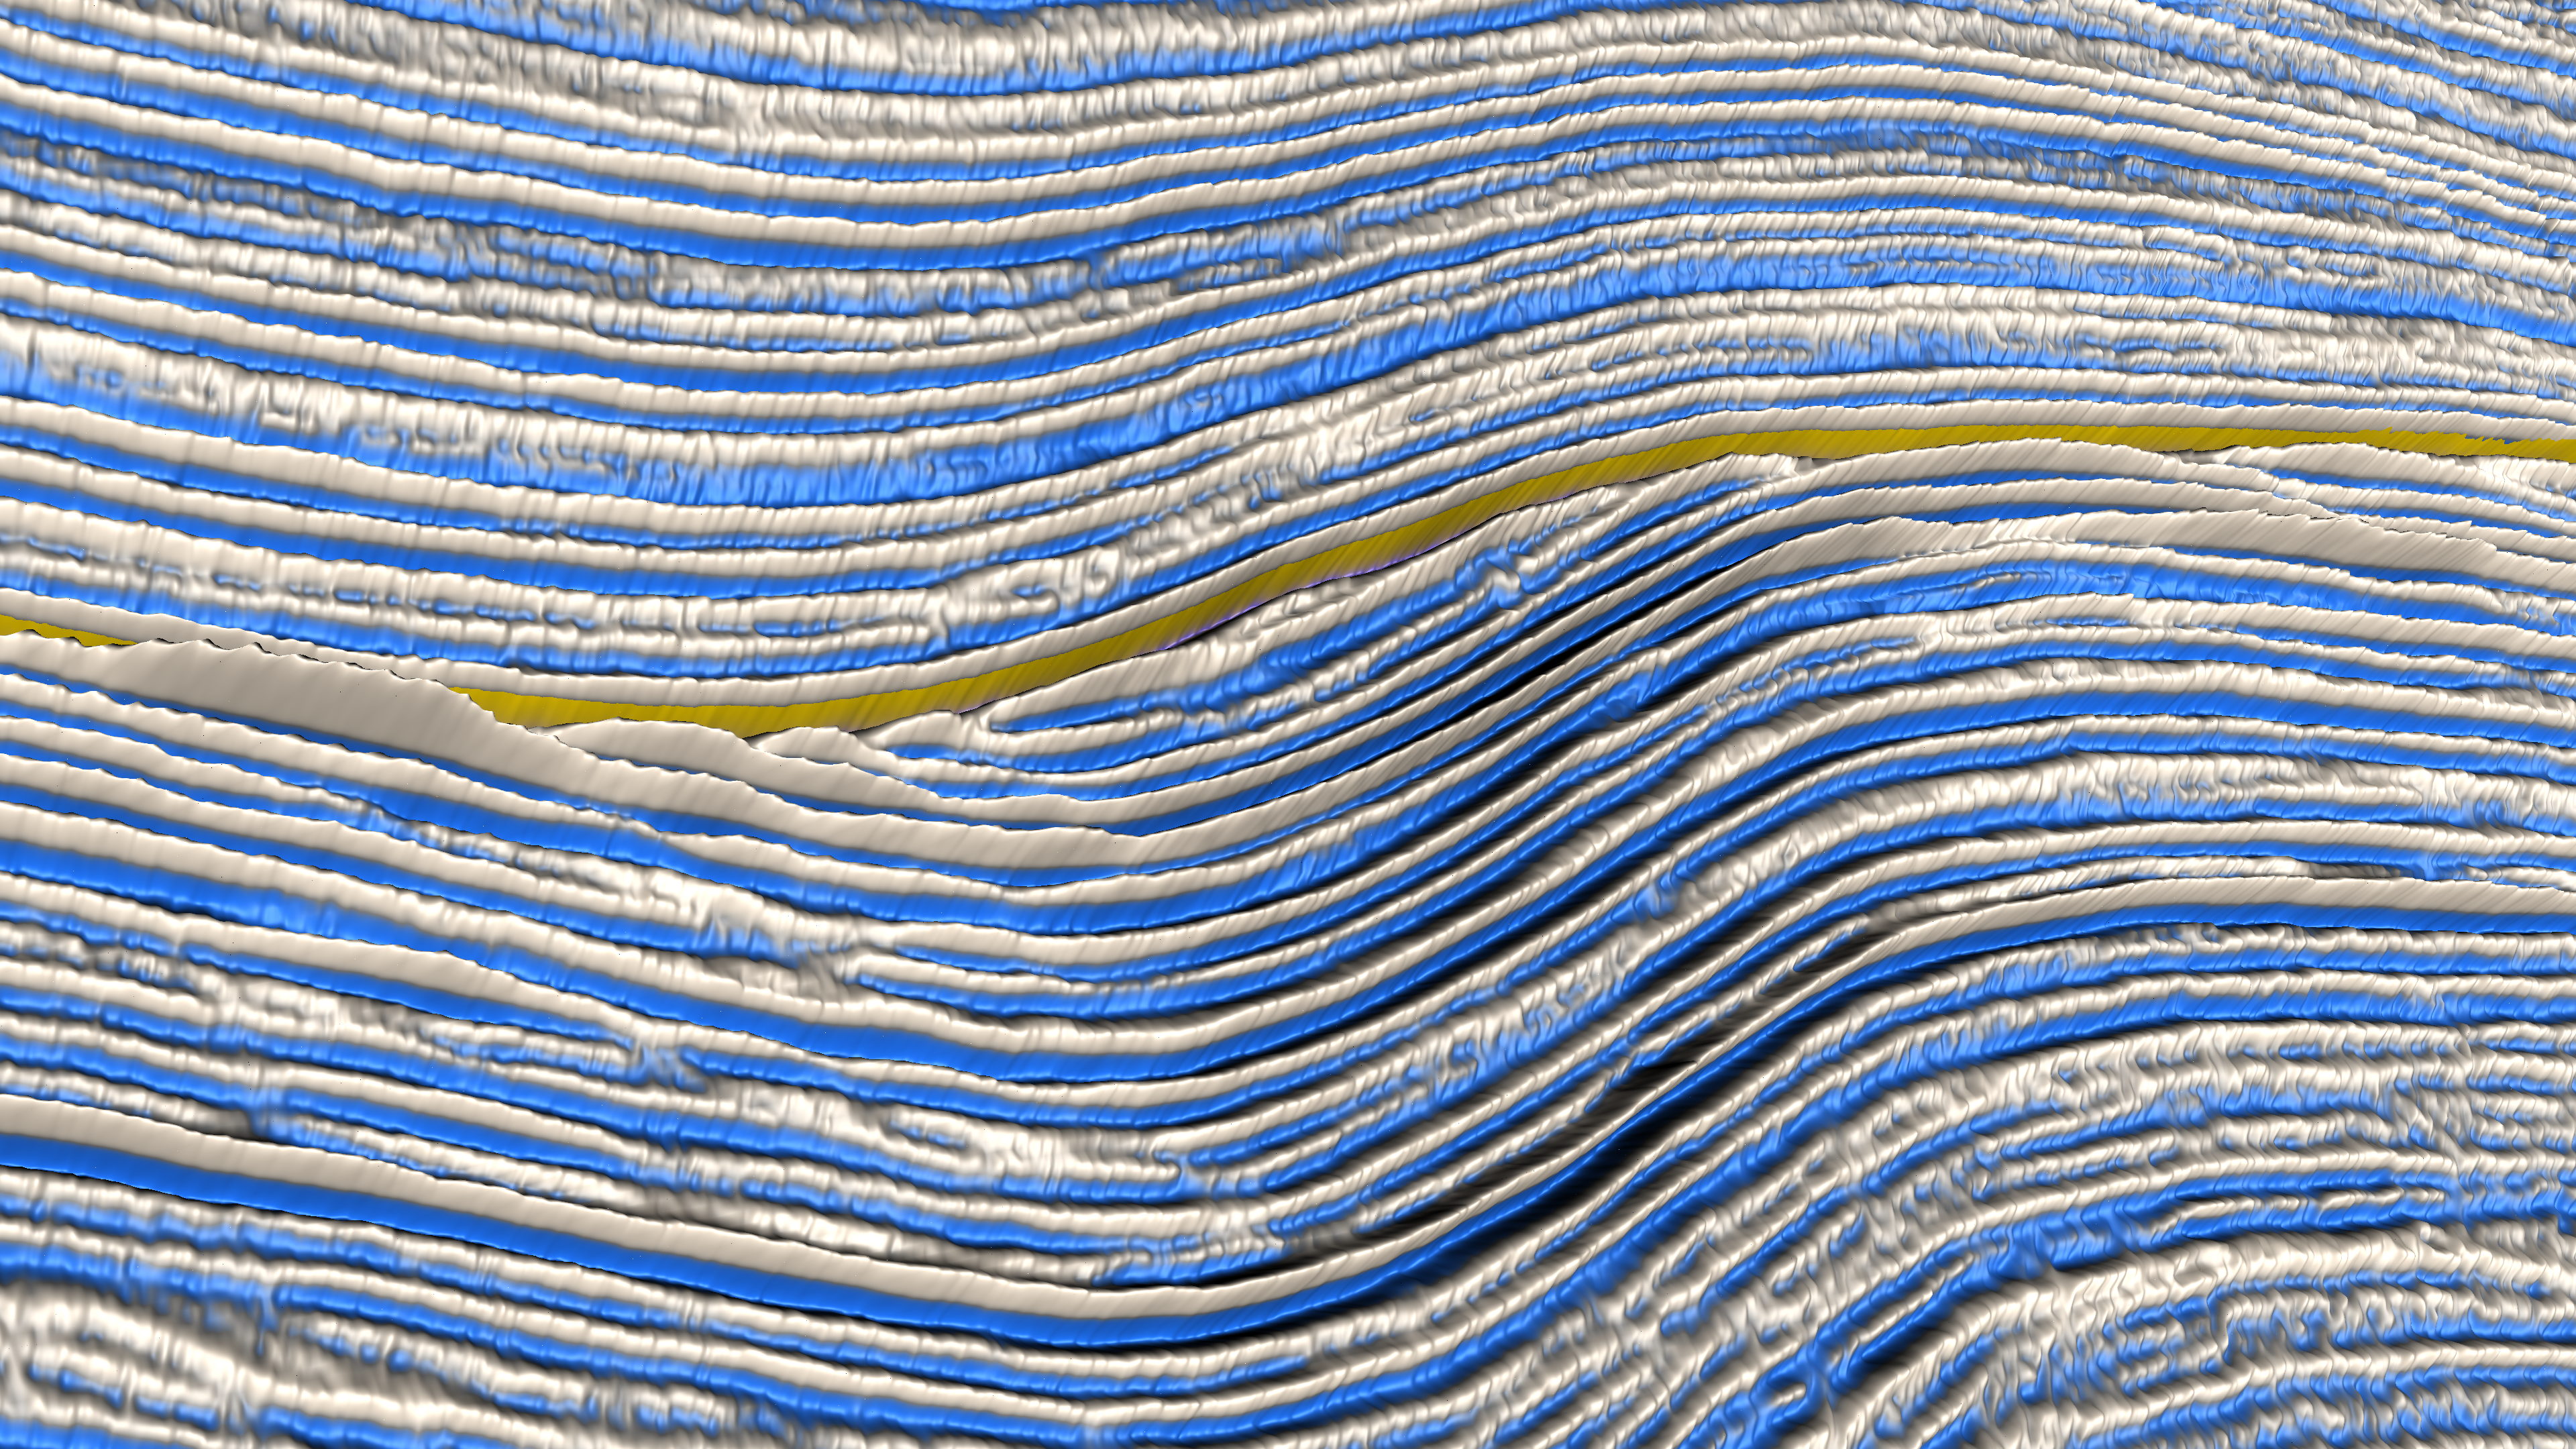
After all, why have three conventional seismic displays if any of them can show every subtle detail in the seismic? They cannot and that is why we flip between displays depending on what we are looking for. Study the images in this gallery. They are StratiScape displays that show every subtle detail in the seismic. What percentage of those details do you think you see using colour, grayscale, or wiggle traces? Can you quantify it? And, more to the point, do you know what the missing details will give you?
Right now, after decades of working with outmoded displays, the industry, in its entirety, does not appreciate the size of the gap. How can it? You can only interpret what you can see. The gap is what you cannot see, which puts us in the awkward position of having to close the gap before we understand why we need to.
Fortunately, regardless of how great or small the gap is, closing it is a simple matter of incorporating 3D animated StratiScape displays into your existing workflows. But closing it is only the first step because even after you adopt StratiScape displays, your belief of what seismic is and what it is capable of will not have changed. Overcoming that belief, discovering what lies within the seismic information gap, will be the hard part and it may take some time before we fully appreciate what seismic is capable of.
We must start somewhere. Closing that gap and discovering what lies within it is something we must do. I will write a lot more on this but for now, can you imagine deliberately filtering away half of your data before you interpret it? That is what you are doing today and have done every time you have interpreted a section relying on conventional seismic displays. You have filtered away most of the recoverable geological information in the seismic.
I have developed the software to close the gap. I have developed the theories that underly visualization. And, I have put together a library of public domain seismic from basins around the world. What I cannot do is prove the importance of the geological information that lies within the gap. For that, I need professional, experienced geoscientists like yourself.
I need you to study the examples and quantify the importance of the geological details that we can now interpret but could not interpret before. So, join the group “High visual resolution interpretation” on linkedin and become an active contributor to the greatest quest in the history of exploration; the quest to discover what seismic is truly capable of.